S&P/TSX Composite Sector Breadth & Rotation
As of close 2026-10-28 · 214 constituents · generated 2026-10-28 13:38 PDT · equal-weight breadth by GICS sector · data.json
How this works (click to show / hide)
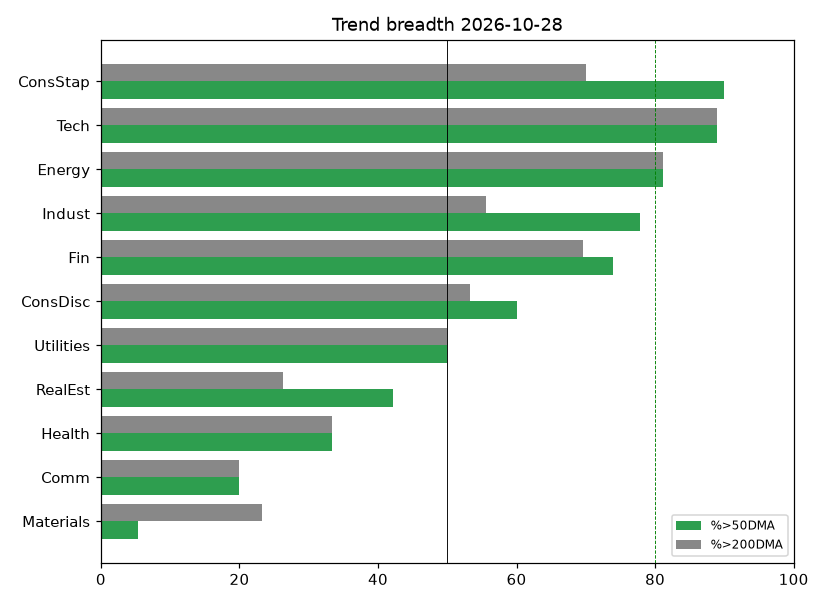
- Breadth = the % of a sector's stocks trading above their 50-day average (short/medium-term trend) and above their 200-day average (long-term trend). Every stock counts equally.
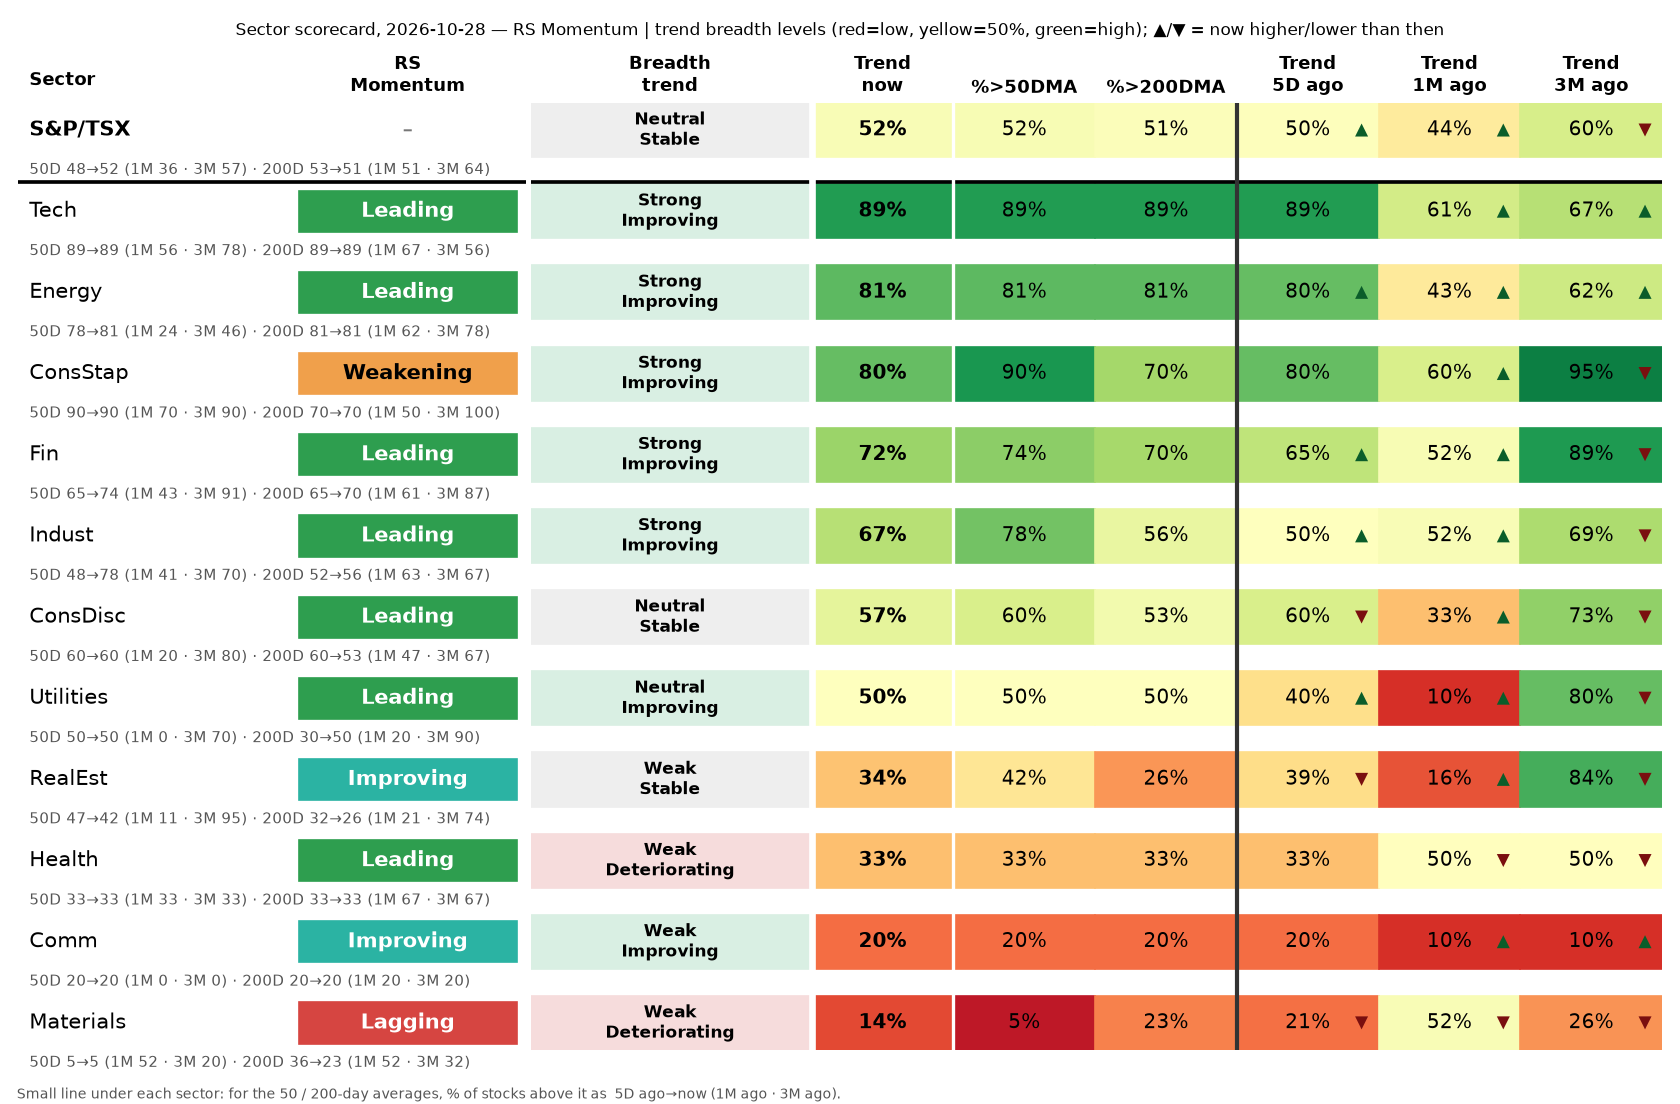
- Trend breadth = the simple average of %>50DMA and %>200DMA. Now / 5D / 1M / 3M ago are its levels today and 5, 21 and 63 trading days earlier; ▲/▼ shows whether it is now higher or lower.
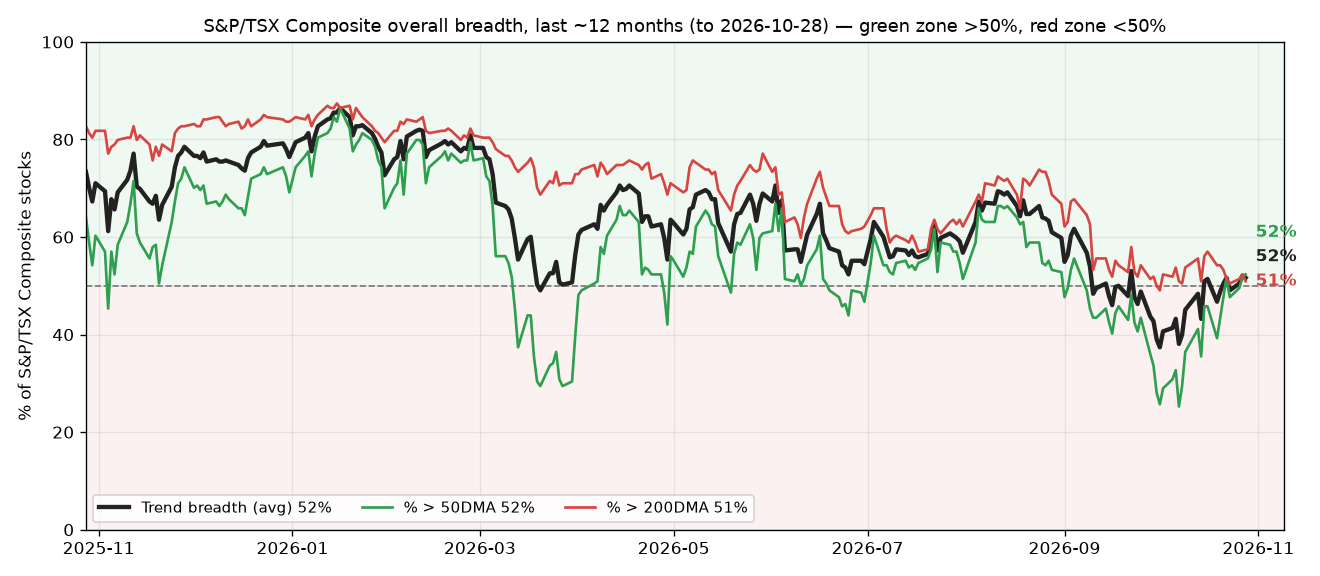
- S&P/TSX row & history chart: the pinned top row pools all ~220 Composite stocks together (it is not an average of the 11 sectors). The history chart shows its trend breadth (black) with %>50DMA (green) and %>200DMA (red) over ~12 months; above 50% (green zone) means most stocks are in an uptrend. "Sector participation" counts how many sectors are Improving / Deteriorating and how many have trend breadth above 50%.
- RS Momentum (the coloured pill, most important column) = how the sector is performing relative to the whole TSX Composite and whether that is speeding up: Leading, Improving, Weakening or Lagging (see the rotation chart below).
- Click a sector name to see its 50D/200D history (a small popup with the % of its stocks above the 50- and 200-day averages: 5D ago, 1M ago, 3M ago and now).
- Small line under each sector: for the 50- and 200-day averages, the % of that sector's stocks above it, shown as 5 days ago → now (1M ago · 3M ago). Shaded red (low) to green (high).
- Level: Strong ≥ 60%, Neutral 40–60%, Weak < 40%.
- Direction (from the changes): Improving = up 10+ pts over 1M and not down over 5D. Deteriorating = down 10+ over 1M and not up over 5D. Reversing Up = down 10+ over 1M but up 10+ over 5D. Reversing Down = up 10+ over 1M but down 10+ over 5D. Otherwise Stable.
- Highs − lows (H-L) = % of stocks at a 20-day (or 52-week) closing high minus % at a low. Positive means more new highs than lows.
- Score (0–100) = 50% trend breadth + 25% highs−lows + 25% relative-strength momentum rank vs the other sectors. "Wk Δ" is the change vs 5 days ago.
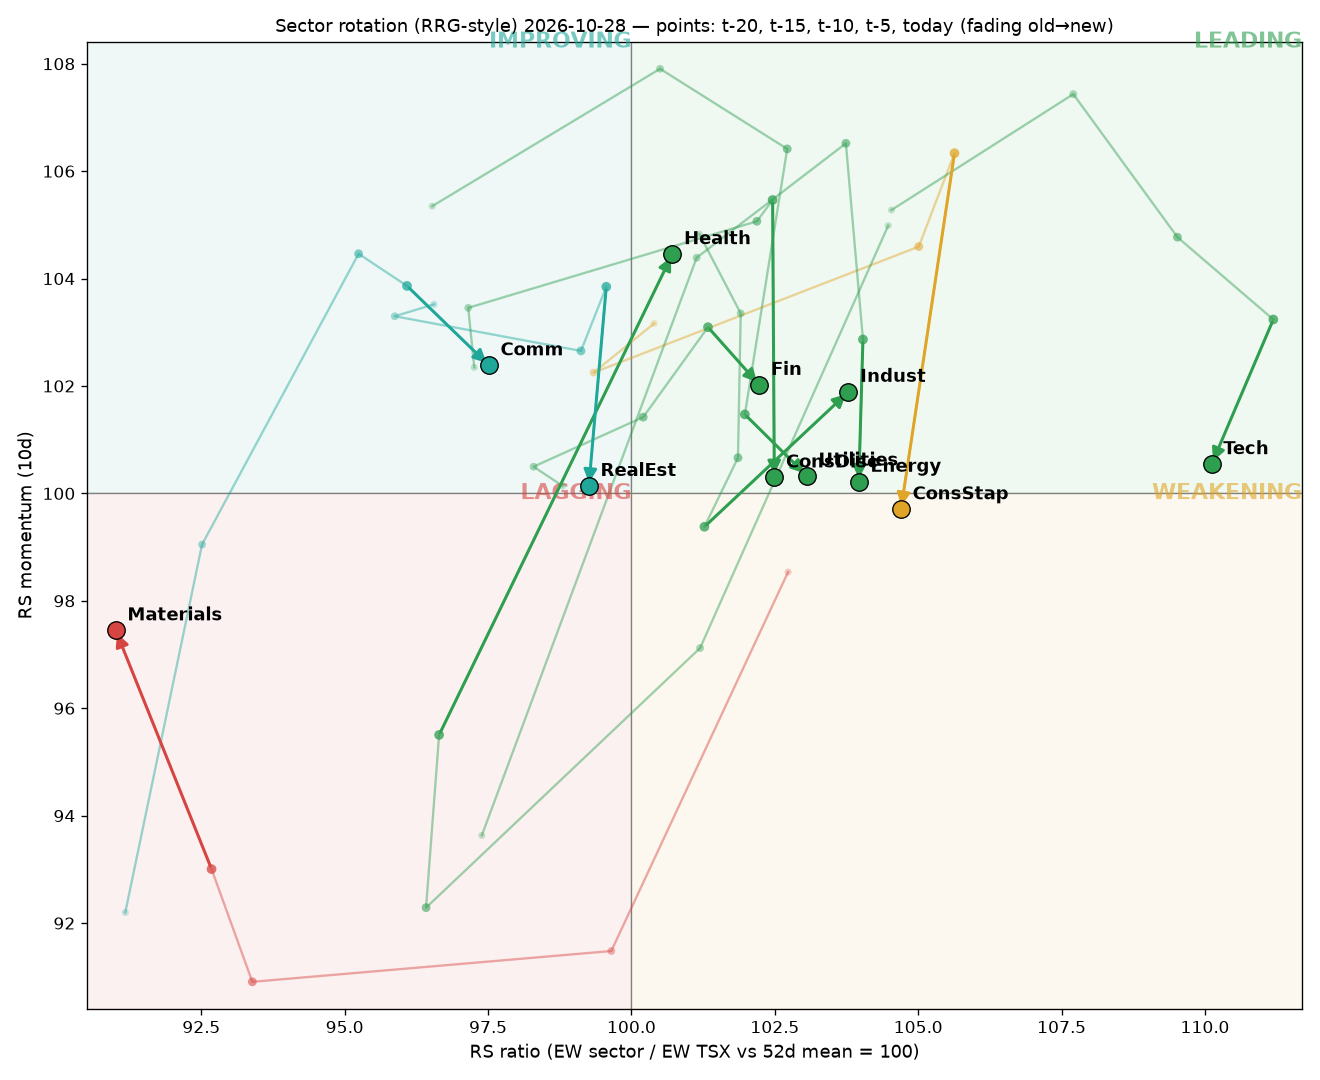
- Rotation chart: each sector's equal-weight index (daily average return of its member stocks, compounded) vs an equal-weight index of all TSX Composite members. The same method is used for every sector because several sectors (Industrials, Consumer Discretionary, Communication Services, Health Care) have no TSX sector ETF (x: above/below 100 = outperforming/underperforming its recent average) against how fast that is changing (y). RS Momentum labels (shown as the coloured pill next to each sector): Leading (strong & rising), Weakening (strong but fading), Lagging (weak & falling), Improving (weak but rising). Tails show weekly points over the last month (t-20, -15, -10, -5, today); the arrow marks today.
- Small sectors: Health Care (3 stocks), Communication Services (5) and Information Technology (9) are small, so one stock moves their breadth by 11–33 points; read them with care (see N column).
- Industry flags: a GICS industry with at least 4 stocks (smaller groups are skipped) is flagged when its %>50DMA differs from its sector's by more than 25 points – an early sign of what is driving (or lagging) the sector.
- Data: daily closes from Yahoo Finance; the day's bar is used only after the close. Not investment advice.
Rotation (RRG-style) with weekly tails
Sector table (click headers to sort)
| Sector | RS Momentum | N | Score | Wk Δ | Breadth trend | Trend | %>50 | %>200 | 5D ago | 1M ago | 3M ago | H-L 20d | H-L 52w | RS rank (Δ1w/1m/3m) |
|---|---|---|---|---|---|---|---|---|---|---|---|---|---|---|
| S&P/TSX▾ | – | 214 | – | – | Neutral · Stable | 52% | 52% | 51% | 50% ▲ | 44% ▲ | 60% ▼ | +7 | +2 | – |
| Fin▾ | Leading | 23 | 76.4 | +9.0 | Strong · Improving | 72% | 74% | 70% | 65% ▲ | 52% ▲ | 89% ▼ | +43 | +17 | 7 (-1/-1/-5) |
| Tech▾ | Leading | 9 | 72.9 | -6.9 | Strong · Improving | 89% | 89% | 89% | 89% | 61% ▲ | 67% ▲ | +0 | +0 | 1 (-0/+1/-0) |
| Indust▾ | Leading | 27 | 64.9 | +20.2 | Strong · Improving | 67% | 78% | 56% | 50% ▲ | 52% ▲ | 69% ▼ | +7 | +0 | 4 (+3/-0/+1) |
| Energy▾ | Leading | 37 | 64.5 | -2.3 | Strong · Improving | 81% | 81% | 81% | 80% ▲ | 43% ▲ | 62% ▲ | +14 | +5 | 3 (-0/+4/+5) |
| Health▾ | Leading | 3 | 58.3 | +20.5 | Weak · Deteriorating | 33% | 33% | 33% | 33% | 50% ▼ | 50% ▼ | +33 | +0 | 8 (+1/-7/+2) |
| ConsStap▾ | Weakening | 10 | 57.0 | -23.0 | Strong · Improving | 80% | 90% | 70% | 80% | 60% ▲ | 95% ▼ | +0 | +0 | 2 (-0/+3/+2) |
| Utilities▾ | Leading | 10 | 51.1 | +8.3 | Neutral · Improving | 50% | 50% | 50% | 40% ▲ | 10% ▲ | 80% ▼ | +0 | +0 | 5 (-0/+5/+2) |
| ConsDisc▾ | Leading | 15 | 50.5 | -15.5 | Neutral · Stable | 57% | 60% | 53% | 60% ▼ | 33% ▲ | 73% ▼ | -7 | -7 | 6 (-2/+2/-3) |
| Comm▾ | Improving | 5 | 45.2 | +2.3 | Weak · Improving | 20% | 20% | 20% | 20% | 10% ▲ | 10% ▲ | +0 | +0 | 10 (-0/+1/-1) |
| RealEst▾ | Improving | 19 | 34.4 | -17.3 | Weak · Stable | 34% | 42% | 26% | 39% ▼ | 16% ▲ | 84% ▼ | -11 | -5 | 9 (-1/-0/-3) |
| Materials▾ | Lagging | 56 | 21.7 | -0.9 | Weak · Deteriorating | 14% | 5% | 23% | 21% ▼ | 52% ▼ | 26% ▼ | -2 | +0 | 11 (-0/-8/-0) |
Score = 50% trend breadth (avg %>50/200DMA) + 25% highs−lows (20d/52w) + 25% RS-momentum percentile. 5D/1M/3M ago = trend breadth level 5, 21 and 63 trading days earlier; ▲/▼ shows whether it is now higher/lower.
S&P/TSX overall (all 214 stocks pooled, not an average of sectors): positive 1M return 57% · daily A/D net -8% · H-L 20d +7, 52w +2
Sector participation: 7 Improving · 2 Deteriorating · 0 Reversing Up · 0 Reversing Down · 2 Stable · 6/11 sectors with trend breadth > 50% · 6/11 with %>50DMA > 50%
Overall S&P/TSX Composite breadth history (~12 months)
Flags
- ConsStap: RS momentum Leading -> Weakening (vs prior day)
- Energy: %>50DMA crossed above 80% (76 -> 81)
- Health: RS momentum Improving -> Leading (vs prior day)
- Indust: RS momentum Weakening -> Leading (vs 1wk ago)
- Tech: RS momentum Weakening -> Leading (vs prior day)
- RealEst: RS momentum Leading -> Improving (vs prior day)
- RealEst: %>50DMA crossed below 50% (58 -> 42)
Trend breadth & change heatmap
%>50DMA / %>200DMA
Industry divergences (>25pt gap in %>50DMA vs sector, ≥4 members)
| Sub-industry | Sector | N | %>50DMA | Sector %>50DMA | Gap (pts) |
|---|---|---|---|---|---|
| Other Energy Sources | Energy | 4 | 0% | 81% | -81 |
| Asset Management | Fin | 5 | 40% | 74% | -34 |
| Real Estate | RealEst | 4 | 75% | 42% | +33 |
Data notes
- ARX.TO: stale (last 2026-09-04)
- BLX.TO: stale (last 2026-08-17)
- IIP-UN.TO: stale (last 2026-07-10)
- OLA.TO: stale (last 2026-08-04)
- SES.TO: stale (last 2026-09-02)
- excluded 5 stale tickers (no recent Yahoo price, likely acquired/renamed): ARX.TO, BLX.TO, IIP-UN.TO, OLA.TO, SES.TO
Source: Yahoo Finance daily closes (free, may have gaps/revisions); constituents and GICS sector/industry from Wikipedia (S&P/TSX Composite Index page). Same-day bars before the close are dropped. Not investment advice.